Past Issues
Silver-incorporated TiO2 Nanofibers via Electrospinning: An Efficient Antibacterial Agent
Misbah Rasheed*
Department of Physics, Hazara University, Pakistan
*Corresponding author: Misbah Rasheed, Department of Physics, Hazara University, Mansehra, Dhodial, Pakistan, Phone: 09826283791; E-mail: [email protected]
Received Date: September 26, 2024
Publication Date: December 19, 2024
Citation: Rasheed M. (2024). Silver-incorporated TiO2 Nanofibers via Electrospinning: An Efficient Antibacterial Agent. Material Science. 6(2):36.
Copyright: Rasheed M. © (2024).
ABSTRACT
Pure as well different concentrations of silver-loaded titanium dioxide (TiO2) nanofibers of uniform and smooth surfaces were prepared by the sol gel and Electro-spinning technique primarily consists of TiP/pvp. The mean diameter of the obtained nanofibers ranges between 20 nm and 120 nm. The effect of silver loading on the fiber size and crystal structure was investigated. Post-calcination of nanofibers mats on 500°C resulted from the rutile phase to the anatase phase transformation. The effect of temperature (500°C was also studied on the size and morphology of the nanofibers. The structural, morphological, compositional, and optical properties were investigated by using X-ray diffraction (XRD), scanning electron microscopy (SEM), and UV-Vis absorption spectroscopy. In addition to this, the antibacterial effect of pure TiO2 and Ag-loaded TiO2 nanofibers were also studied against E. coli. and S. aureus. by using the Kirby Bauer method.
Keywords: Electrospinning, Titanium Dioxide, Loading, Nanofibers
INTRODUCTION
Titanium dioxide (TiO2) is one of the wide band gap semiconductor used in sensors, antibacterial agents, self-cleaner, water purification, transparent electrode, and other optoelectronic devices [1,2]. TiO2 exists in three crystalline phases rutile phase, anatase phase, and brookite phase, but most common crystalline polymorphs of TiO2 are metastable A and stable R-phases. The anpresence of either or both of these crystalline phases impacts the antibacterial performance of TiO2. A-phase has been reported to have a lower surface enthalpy and surface free energy than R-phase. Rutile and anatase have tetragonal structures while brookite has the orthorhombic structure [3]. The rutile phase is widely used in cosmetics, ultraviolent (UV) absorbance, and high-quality paints because of its high refractive index and UV absorbance [4]. Anatase phase is an optically and electrically +active and can be used an antibacterial agent, solar cells, in photonic devices and photo-catalysis [5]. titanium dioxide can be synthesized in the form of powder, thin films, etc. Thin films of TiO2 can be prepared by the gas phase method. The important techniques are Chemical Vapor Deposition (CVD) [6], Spray Pyrolysis Deposition (SPD) [7] and Physical Vapor Deposition (PVD) [6].
Electro-spinning is a widely used technique to synthesize nanofibers. In this research work, TiO2/PVP, a hydrophilic polymer composite nanofiber was prepared by the sol-gel method combining with electrospinning technique. Specifically, the photocatalytic nature of titanium dioxide has made it’s the best candidate of antimicrobial agent because it is a non-toxic, chemically stable, low cost, and Generally Recognized as Safe (GRAS) substance. Moreover, the silver/anatase composite nanofibers exhibited an excellent antibacterial rather than pure TiO2 nanofibers [8].
The aim of this research work is to study the effect of silver (Ag) on the morphology, crystal structure and optical band gap of TiO2 nanofibers. Silver ions continuously release silver ions which play an important role in killing the bacteria; therefore, antibacterial properties of TiO2 have also been studied against E. coli and S. aureus.
Experimental
For the electrospinning suspension, 1.5 ml of titanium (IV) isopropoxide was mixed with 3 ml of acetic acid and left on stirring for 30 min continuously at room temperature, named as solution 1. In parallel, sliver nitrate (AgNO3), 3 ml of DMF and 0.6 g of PVP (MW is 189,000) was added to 7 ml of ethanol and stirred for 15 min, named as solution 2. The solution 2 and solution 1 are mixed with four different loading concentration (0, 5, 10 and 15 wt % of the TiP) of silver nitrate for the electrospinning. Finally, the mixed solutions put on the stirrer for one hour. The as-prepared solution was used for the electrospinning to prepare nanofibers.
Figure 1. Schematic of the material synthesis.
The suspension was loaded into a syringe with a 26-gauge metallic needle. The high voltage D.C. power supply capable to generate 50 kV (Del Electronics Crop) was connected at the tip of the needle. The feeding rate was controlled by using a microcontroller. The feeding rate was kept at 1 ml/hr. The collector's copper plate was wrapped with aluminum foil and the distance between the tip of the syringe and the collector was kept at 14 cm to collect the nanofibers. An electrical field (20 kV) is applied between the syringe metallic needle and the grounded collector by the use of a high voltage supply. As the strength of the applied field increases, the curved surface of the fluid at the needle tip of the capillary tube stretches to form a cone known as the T- cone or Taylor cone [9,10]. The highly impermeable nanofibers are collected at a grounded collector, woven as well as non-woven mats [11,12]. The prepared nanofibers were left in the air for at least 3 hours to dry and complete the hydrolysis of TiP. In the end, the as-spun nanofibers were calcined in a furnace at temperature 500°C with 5°C/min for three hours for to remove PVP and other unwanted species.
Figure 2. Vertical Arrangement for Electro-spinning.
The surface morphology and the elemental analysis of the nanofibers were studied by using scanning electron microscopy (Format Jeo/Eo, versioin1.1) equipped with EDX. The crystal phases of the nanofibers were observed by using an X-rays diffractometer (MIA Cu Kα radiative source). The Optical band gaps of the Ag-loaded TiO2 nanofibers were studied by using UV-vis spectroscopy. Raman spectroscopy was used to study molecular interactions, chemical structure, phase and polymorph of the nanofibers. Antibacterial test was done by using Kirby-Bauer technique.
RESULTS AND DISCUSSION
SEM Analysis
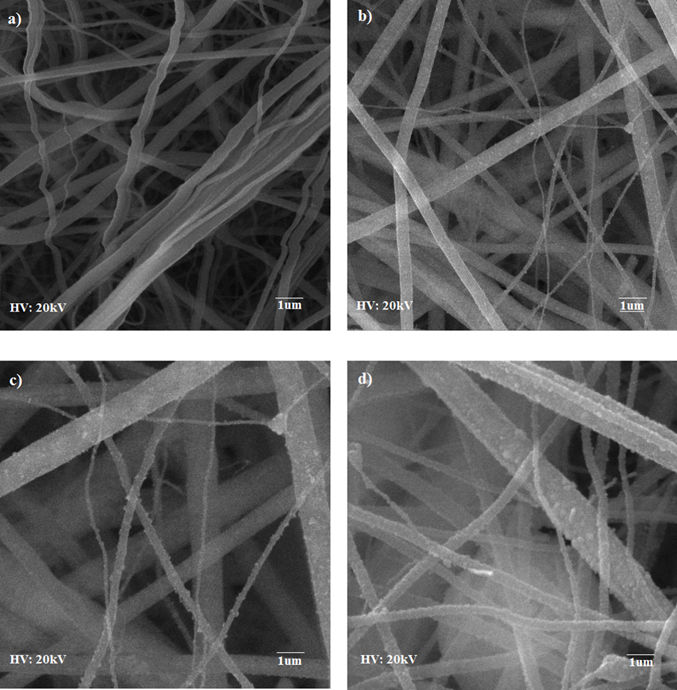
SEM micrographs in Figure 3 confirm the formation of continuous and thin long nanofibers. The surface of Ag-loaded TiO2 nanofibers is rough compared to pure TiO2 nanofibers. The diameter of silver loaded TiO2 nanofibers decreased because Ag-loaded TiO2 has only the anatase phase which has a smaller grain size as compared to the rutile phase. Moreover, the diameter of calcinated nanofibers is small as compared to the as-spun nanofibers due to elimination of PVP, ethanol, rearrangement of atoms, the disintegration of TiP, and the subsequent sintering [13].
It is shown in micrographs that dendrite like structures were grown on the nanofibers surfaces which are due to the silver ions over the entire surface. These dendrites like structures have also been reported for other metals like copper, gold, zinc and silver as well and have been analyzed for different materials like ceramic, polymers, etc. [14,15].
Figure 3. SEM micrographs of Calcined nanofibers at 500°C a) Pure TiO2 b) 5 wt % Ag c) 10 wt % Ag d) 15 wt % Ag loaded TiO2 nanofibers.
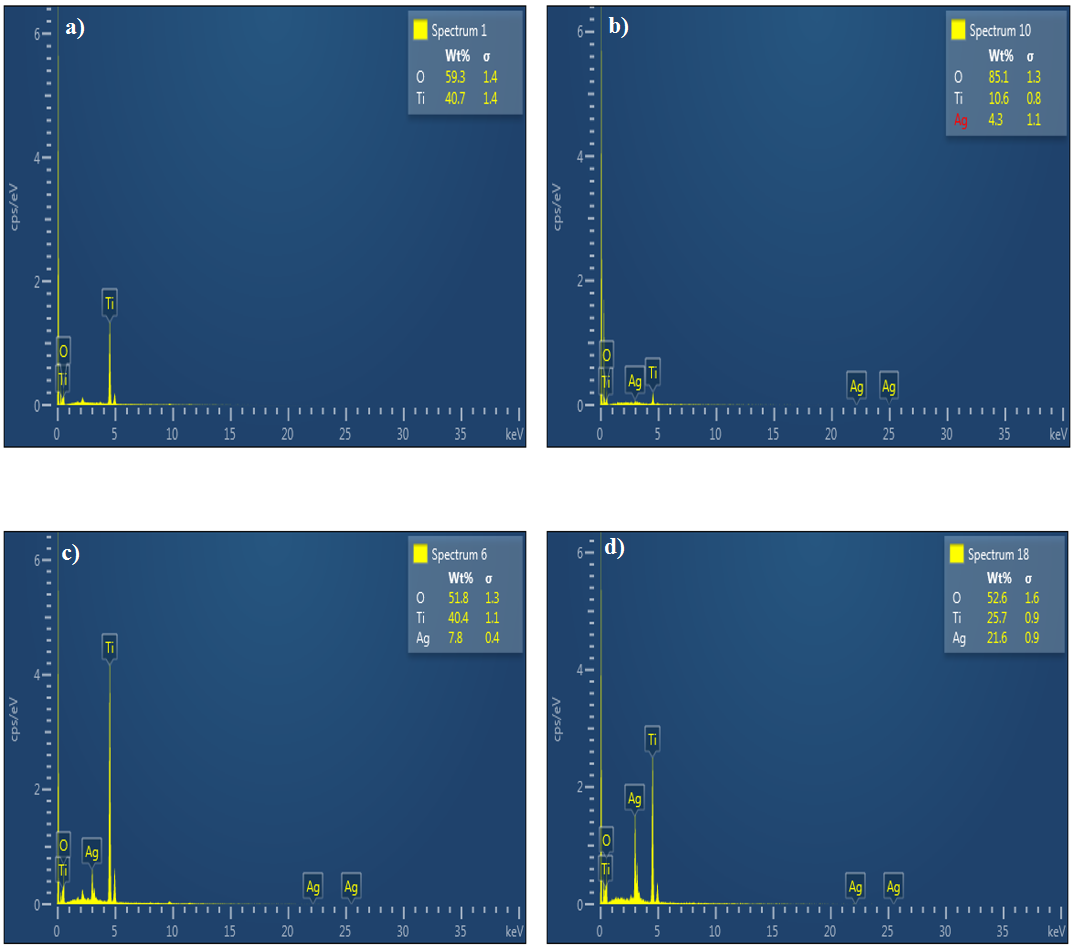
To confirm the Ag particles are present in the TiO2 nanofibers, Energy dispersive X-ray spectroscopy (EDX) has been used at different points of the nanofibers and obtained different concentrations of the silver in fibers shown in Figure 4. According to EDX the fiber composition of each element is shown in the table 1 below:
Table 1. Percentage composition of each element in the electrospun nanofibers calcined at 500 °C
|
Samples |
Ti (%) |
Oxygen (%) |
Silver % |
|
Pure TiO2 |
|
|
|
|
5 wt % Ag-TiO2 |
|
|
|
|
10 wt % Ag-TiO2 |
|
|
|
|
15 wt % Ag-TiO2 |
|
|
|
Figure 4. EDX spectroscopy pattern of calcined nanofibers at 500°C a) Pure TiO2 b) 5 wt %Ag c) 10 wt % Ag d) 15 wt % Ag loaded TiO2 nanofibers.
X-ray Diffraction
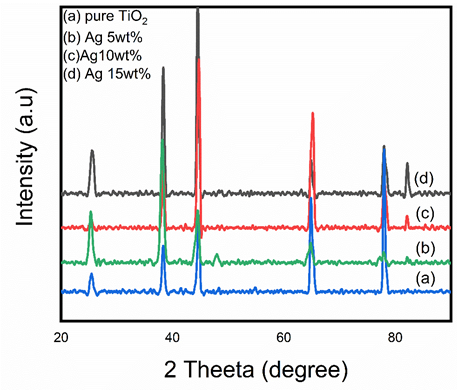
X-ray diffraction (XRD) is used to study the crystallographic structure, orientation of the planes and the identification of crystalline materials [16]. From the Figures, it was found that both anatase and rutile phases are present in the pure TiO2, but as the concentration of Ag increased the rutile phase disappeared. The fact is that due to pinning of domain boundaries the domain mobility is limited by crystal defects [17]. The un-dissolved silver particles remain at the grain boundaries leading to reduce the particle contact and restrict them from grain growth and phase transition. Thus, silver content restricted the anatase phase to rutile phase transformation. Ag-loaded TiO2 nanofibers has a larger crystallite size than the pure TiO2 nanofibers. Seery et al. reported that the silver ion has a larger radius of 130 pm compared to the 68 pm of TiO2, therefor Ag particles remain at the surface, preventing the phase transformation [18]. As the Ag concentration increased, dislocation density also increased. The dislocation density can be determined by using the formula σ = 1/D2 lines/nm2. In the Figure 5, the diffraction peaks at 25.63°, 44.54°, 64.79°, and 77.96° corresponds to the planes of (101), (002), (312), and (103) respectively, which represent the formation of anatase phases of Titania. The peak of rutile phase can be seen at 38.29° and 47.6° respectively, which are associated with the lattice planes of (211) and (303) (PDF number 01-083-2243). In Figure 5-d diffraction peaks of metallic silver at 77.76o and 82.19o and were produced with crystal planes of (022) and (222) which were confirmed by the (PDF number 01-073-1774).
Figure 5. XRD pattern of Calcined nanofibers at 500°C a) Pure TiO2 b) 5 wt % Ag c) 10 wt % Ag d) 15 wt % Ag loaded TiO2 nanofibers.
UV-Vis Spectroscopy
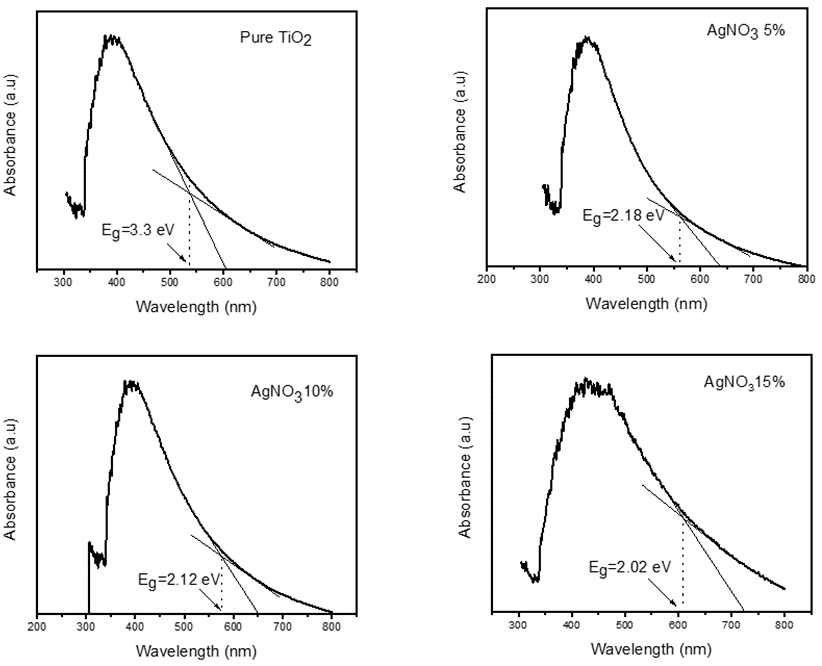
Ultraviolet spectroscopy is used to investigate the optical properties of TiO2 and silver-doped TiO2 nanofibers. Pure TiO2 nanofibers have the band gap spectra in the UV range but due to the incorporation of silver in the titanium dioxide, its absorbance band relocate to redshift of light in the region of 300 nm – 610 nm with the increase in the absorption of light. The absorption band gap can be calculated by plotting the horizontal line and the absorbance edge to measure the gap energy.
Plank’s equation is used to find the band gap energies shown in Table 2. The Plank’s equation is E=hf or E=hc/λ, where h is the Plank constant (6.62*10-34 Js), λ is the cut-off wavelength and c is the light velocity (3*108 m/s). Figure 6 shows the UV-Vis absorption spectra of pure and 5%, 10% and 15% Ag loaded TiO2 e-fibers calcined at 500°C.
Silver has a low Fermi level than TiO2. The loaded Ag remains at the surface of the TiO2 nanofibers and acts as the transfer agent for the produced photons. Therefore, Ag increased the separation time of electron-hole pair and decreases their recombination consequential in increasingly visible light absorption.
Table 2. Representing the cut-off wavelength (nm) and band gap (eV) of Pure and Ag- loaded TiO2 nanofibers calcined at 500°C
|
Materials |
Calcination Temperature (°C) |
Cut off Wavelength (nm) |
Band gap (eV) |
|
Pure TiO2 nanofibers |
500 |
538 |
3.3 |
|
5% Ag- loaded TiO2 nanofibers |
500 |
560 |
2.18 |
|
10% Ag- loaded TiO2 nanofibers |
500 |
576 |
2.12 |
|
15% Ag- loaded TiO2 nanofibers |
500 |
608 |
2.02 |
Figure 6. UV-vis spectroscopy of calcined nanofibers at 500°C a) Pure TiO2 b) 5 wt %Ag c) 10 wt % Ag d) 15 wt % Ag loaded TiO2 nanofibers.
Raman Spectroscopy
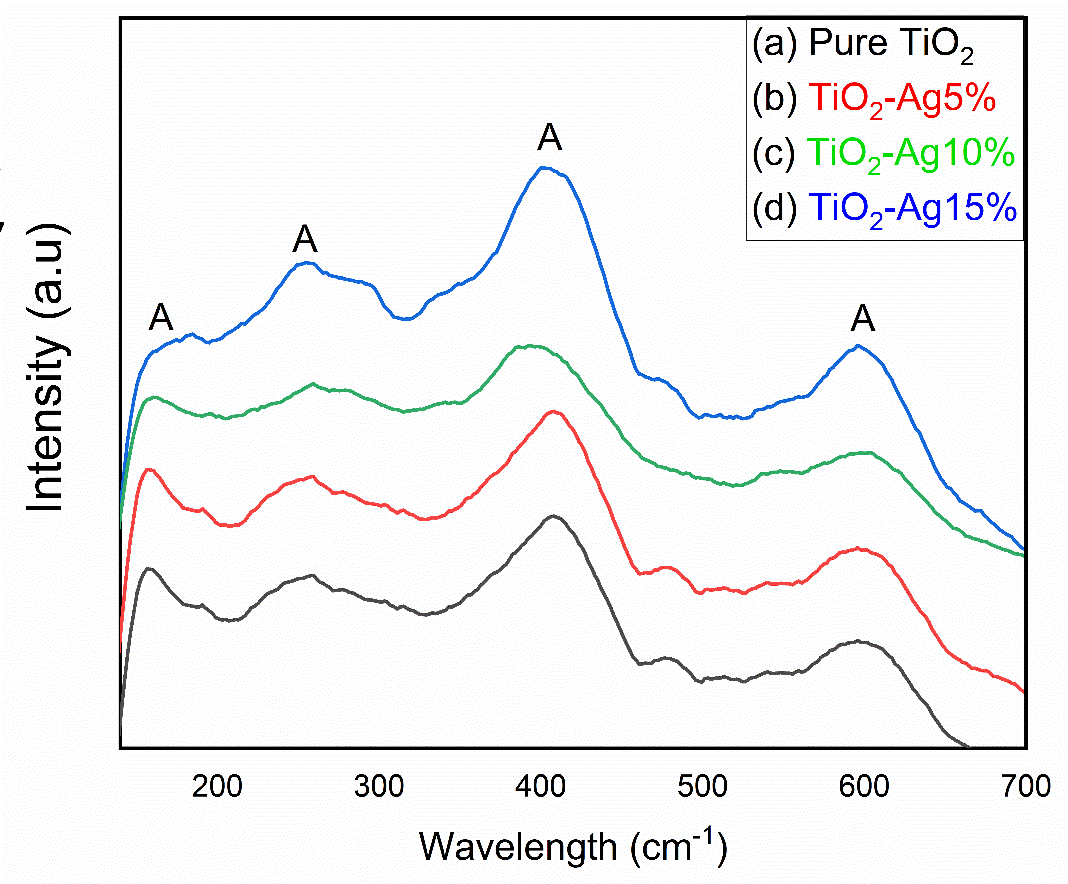
Raman spectroscopy (RS) is a non-destructive technique which gives us complete information about crystallinity, molecular interactions, chemical structure, phase and polymorph of materials. In this work, TiO2 nanofibers were studied as a function of silver loading into nanofibers matrices and their transformation from rutile to anatase phase at elevated temperature (500°C). Figure 7 shows four distinctive vibrational peaks, which corresponds to 158(gap energy), 257(B1), 406(A1) and 598(gap energy) cm-1, respectively. All the peaks were assigned to anatase phase of the TiO2 nanofibers because at higher temperature the dominant phase is anatase. The two vibration peaks observed at 158 cm-1 and 257 cm-1 are attribute to O—Ti—O bending mode while the other two vibrating modes observed at 406 cm-1 and 598 cm-1 attribute to O—Ti bond stretching type mode. A very small peak of TiO2 anatase phase were also observed at 190 cm-1 [19].
Figure 7. Raman Spectra of Calcined Nanofiber at 500°C a) Pure TiO2 b) 5 wt %Ag c) 10 wt % Ag d) 15 wt % Ag loaded TiO2 nanofibers.
Antibacterial Capability of TiO2/Ag Composite Nanofibers
Various tests such as Kirby-Bauer, Agar diffusion or Disk diffusion have been used for study the resistance or resistivity of the pathogenic bacteria as a standard for many years [20]. Disk diffusion technique was first used in the 1950s, and later modified by W. Kirby and A. Bauer (Kirby-Bauer) and finally becomes the standardization by the WHO in 1961. This method is used to test the susceptibility of an antibiotic against pathogenic bacteria. The resistance of the bacterium or sensitivity of the antibiotic is measured by the circular path around the antibiotic disk.
The Antibacterial activities of pure and Ag-loaded TiO2 nanofibers were studied against Gram +ve (S. aureus). and Gram –ve (E. coli). bacteria by using the disk diffusion method. Firstly, Ag ions (Ag+) interact to the bacterial cell wall, delaying transport of materials in and out of the cell. Secondly, in the bacterial cell, Ag-ions bind with DNA and prevent bacterial cell division stopping. Lastly, Ag-ions are entered into the bacterial cell, where they chunk the respiratory system of the bacteria abolishing the energy production of the cell. Kim et al [21] have proposed that AgNPs has the ability to produce free radicles which are responsible to damage the cell membrane of the bacteria. In Figure (8-f), the 25mm clear inhibitory zone appeared around 20 mg of 10% Ag-loaded TiO2 nanofibers against E. coli. after incubation throughout the day (24 hours). The S. aureus. (24mm) in Figure (8-e) showed that silver loaded TiO2 nanofibers are effective against pathogenic bacteria. From the results it is found that higher concentration of silver reduced their effectiveness against bacteria, this is because of the reduction in active species (Ag particles), which were associated with the agglomeration of Ag-grains [22]. Based on the zone of inhibition analysis, in Table 4, it was found that when the bacterial strain is subjected to 10 wt % silver loaded TiO2 nanofibers, the inhibition zone of S. aureus. and E. coli. were increased significantly.
Relatively, Gram +ve have more negatively charged peptidoglycan in their cell wall than Gram –ve. Therefore, Gram +ve bacteria may allow less Ag+ to reach the plasma membrane than Gram –ve species. It is also concluded from the results that antimicrobial activities of calcined TiO2 nanofibers are slightly more than its as-spun nanofibers, due to transformation of the amorphous phase to pure anatase TiO2 nanofibers at 500°C, which have the indirect band gap of 3.2 eV [23].
Table 3. Antibacterial activity of pure and 5 wt % Ag-loaded TiO2 nanofibers calcine at 500°C
|
Sr. No |
Pathogenic Bacteria |
Zone of inhibition (mm) |
|||||||
|
The concentration of calcined 10 wt % Ag loaded TiO2 nanofibers |
The concentration of calcined 15 wt % Ag-loaded TiO2 nanofibers |
||||||||
|
2.5 (mg) |
5 (mg) |
10 (mg) |
20 (mg) |
2.5 (mg) |
5 (mg) |
10 (mg) |
20 (mg) |
||
|
01 |
S.aureus |
0mm |
10mm |
20mm |
24mm |
0mm |
6mm |
16mm |
21mm |
|
02 |
E. coli |
0mm |
12mm |
22mm |
25mm |
0mm |
8mm |
18mm |
22mm |
Figure 8. Antibacterial activity of Electro-spun nanofiber calcined at 500°C a) Pure TiO2 nanofiber against S.aureus b) Pure TiO2 Pure TiO2 nanofiber against E.coli c) 5 wt % Ag against E.coli d) 5 wt % Ag against S.aureus. e) 10 wt % Ag against S.aureus. f) 10 wt % Ag against E. coli. g) 15 wt % Ag against E. coli. h) 15 wt % Ag against S.aureus.
Table 4. Antibacterial activity of 10 and 15 wt % Ag- loaded TiO2 nanofibers calcined at 500°C
|
Sr. No. |
Pathogenic Bacteria |
Zone of inhibition (mm) |
|||||||
|
The concentration of calcined Pure TiO2 nanofibers |
The concentration of calcined 5 wt % Ag-loaded TiO2 nanofibers |
||||||||
|
2.5 (mg) |
5 (mg) |
10 (mg) |
20 (mg) |
2.5 (mg) |
5 (mg) |
10 (mg) |
20 (mg) |
||
|
1 |
S.aureus. |
0mm |
9mm |
16mm |
20mm |
0mm |
8mm |
18mm |
22mm |
|
2 |
E. coli |
0mm |
5mm |
18mm |
21mm |
0mm |
10mm |
20mm |
23mm |
CONCLUSION
Silver-doped TiO2/PVP based nanofibers were fabricated by using the electrospinning technique. Electrospun nanofibers were heat treated at 500°C to remove the polymers. The addition of silver enhanced not only the nanofibers crystallinity but also increased the antibacterial activities of the nanofibers. It was found that higher concentration of silver reduced their effectiveness against bacteria, this is because of the reduction in active species (Ag particles), which were associated with the agglomeration of Ag-grains. SEM, EDX, XRD, UV-Vis and Raman spectroscopy confirmed the formation of electro-spun nanofibers. The size of the pure nanofibers was found larger than silver loaded TiO2 nanofibers due to the phase transition from rutile to anatase phase. The optical band gap of the silver loaded nanofibers shifted toward the red-shift because Ag has increased the separation time of electron-hole pair and decreases their recombination time significantly, results in increase visible light absorption.
ACKNOWLEDGEMENTS
None.
CONFLICT OF INTERESTS
The author declares that there is no conflict of interest.
REFERENCES
- Boyle VJ, Fancher ME, Ross RW Jr. (1973). Rapid, modified Kirby-Bauer susceptibility test with single, high-concentration antimicrobial disks. Antimicrob Agents Chemother. 3(3):418-424.
- Carp O, Huisman CL, Reller A. (2004). Photoinduced reactivity of titanium dioxide. Progress in solid state chemistry. 32(1-2):33-177.
- Doh SJ, Kim C, Lee SG, Lee SJ, Kim H. (2008). Development of photocatalytic TiO2 nanofibers by electrospinning and its application to degradation of dye pollutants. J Hazard Mater. 154(1-3):118-127.
- Wang C, Ao Y, Wang P, Hou J, Qian J, Zhang S. (2010). Preparation, characterization, photocatalytic properties of titania hollow sphere doped with cerium. J Hazard Mater. 178(1-3):517-521.
- Soo JZ, Chai LC, Ang BC, Ong BH. (2020). Enhancing the Antibacterial Performance of Titanium Dioxide Nanofibers by Coating with Silver Nanoparticles. ACS Appl Nano Mater. 3:5743-5751.
- Hashimoto K, Irie H, Fujishima A. (2005). TiO2 photocatalysis: a historical overview and future prospects. Japanese journal of applied physics. 44(12R):8269.
- Hidalgo M, Aguilar M, Maicu M, Navío JA, Colón G. (2007). Hydrothermal preparation of highly photoactive TiO2 nanoparticles. Catalysis Today. 129(1-2):50-58.
- Giolli C, et al. (2007). Characterization of TiO2 coatings prepared by a modified electric arc-physical vapour deposition system. Surface and Coatings Technology. 202(1):13-22.
- Li Z, Wang C. (2013). Effects of working parameters on electrospinning. In One-dimensional nanostructures: Springer. pp. 15-28.
- Yang Y, Jia Z, Liu J, Li Q, Hou L, Wang L, et al. (2008). Effect of electric field distribution uniformity on electrospinning. Journal of applied physics. 103(10):104307.
- Al-Hazeem NZA. (2018). Nanofibers and electrospinning method. Nanomater.-Synth. Appl.
- Angammana CJ, Jayaram SH. (2011). The Effects of Electric Field on the Multijet Electrospinning Process and Fiber Morphology. IEEE Trans Ind Appl. 47:1028-1035.
- Li D, Xia Y. (2003). Fabrication of titania nanofibers by electrospinning. Nano letters. 3(4):555-560.
- Fang J, Ding B, Song X, Han Y. (2008). How a silver dendritic mesocrystal converts to a single crystal. Applied Physics Letters. 92(17):173120.
- Govenius J, Lake R, Tan K, Möttönen M. (2016). Detection of zeptojoule microwave pulses using electrothermal feedback in proximity-induced Josephson junctions. Physical review letters. 117(3):030802.
- Chauhan A, Chauhan P. (2014). Powder XRD technique and its applications in science and technology. J Anal Bioanal Tech. 5(5):1-5.
- Raffi M, et al. (2018). Synthesis of Ag-loaded TiO2 electrospun nanofibers for photocatalytic decolorization of methylene blue. Fibers and Polymers. 19(9):1930-1939.
- Pelaez M, et al. (2012). A review on the visible light active titanium dioxide photocatalysts for environmental applications. Applied Catalysis B: Environmental. 125:331-349.
- Feng X, Wang X, Chen X, Yue Y. (2011). Thermo-physical properties of thin films composed of anatase TiO2 nanofibers. Acta Materialia. 59(5):1934-1944.
- Biemer JJ. (1973). Antimicrobial susceptibility testing by the Kirby-Bauer disc diffusion method. Ann Clin Lab Sci (1971). 3(2):135-140.
- Wang L, Ali J, Zhang C, Mailhot G, Pan G. (2020). Simultaneously Enhanced Photocatalytic and Antibacterial Activities of TiO2/Ag Composite Nanofibers for Wastewater Purification. J Environ Chem Eng. 8:102104.
- Fabrega J, Fawcett SR, Renshaw JC, Lead JR. (2009). Silver nanoparticle impact on bacterial growth: effect of pH, concentration, and organic matter. Environ Sci Technol. 43:7285-7290.
- Sanjines R, Tang H, Berger H, Gozzo F, Margaritondo G, Levy F. (1994). Electronic structure of anatase TiO2 oxide. Journal of Applied Physics. 75(6):2945-2951.
 Abstract
  PDF
PDF

