2024: Volume 6, Issue 1
Past Issues
 Abstract
  PDF
PDFDeconvolution of Cyclic Voltammograms in the Hydrogen Region of the Platinum-Black Electrodes with the Asymmetric Double Sigmoid Function
Romulus V Bucur*
Ångström Laboratory, Inorganic Chemistry, Uppsala University, Uppsala, Sweden
*Corresponding Author: Romulus V Bucur, Ångström Laboratory, Inorganic Chemistry, Uppsala University, Uppsala, Sweden; Email: [email protected]
Received Date: March 11, 2024
Publication Date: May 07, 2024
Citation: Bucur RV. (2024). Deconvolution of Cyclic Voltammograms in the Hydrogen Region of the Platinum-Black Electrodes with the Asymmetric Double Sigmoid Function. Material Science. 6(1):26.
Copyright: Bucur RV. © (2024).
ABSTRACT
The deconvolution of the cyclic voltammograms (CVs) using an asymmetric double sigmoid function was tested in the hydrogen region of a model platinum-black electrode to extract and quantitatively evaluate the peaks’ information. CVs were recorded in 1M HClO4 solution, at T = 298 K, for three different values of the minimum scanning potential near the electrode equilibrium potential. The fine structure of CVs is determined by the hydrogen evolution reaction (HER/adsorption) and the hydrogen oxidation reaction (HOR/desorption) that take place at the surface's strong(s) and weak(w) adsorption sites. HER occurs mainly on the w-sites, whose equivalent surface area makes up the electrochemical active surface area (EASA), while that corresponding to the s-sites is inactive. The surface area calculated from the charges of CVs curves yields the electrode’s total surface area with overestimated values of about 30% compared with EASA. In principle, the efficiency of the HER/HOR could be improved by diminishing the density of the strong adsorption sites and/or increasing that of the weak adsorption sites
Keywords: Pt-black, H–region, Cyclic voltammograms, Asymmetric double sigmoid function, Deconvolution, HER/HOR
INTRODUCTION
The cyclic voltammograms (CVs) in the H-region of the Pt-black electrodes in an acid medium are shaped by the partial overlapping of two current peaks generated by one single electrode reaction, H+(aq) + e ⇌ Pt-H*, (H* are the adsorbed hydrogen atoms on the electrode surface). On scanning the potential, this reaction successively occurs by different virtual groups of adsorption sites with similar structural features, having the same level of surface free energy [1]. The peaks are related to the specific structure of the electrode surface, and the adsorbed H-atoms act as a probe that can highlight this in situ. This correlation has been successfully used on the anodic branch of CVs to characterize polycrystalline or single-crystal characterize polycrystalline or single-crystal Pt electrodes [2-4].
In the case of Pt-black electrodes, the overlapped peaks hidden in the voltammograms contain basic information on the overall surface structure and the effect on the dynamics of hydrogen evolution- (HER) or hydrogen oxidation- (HOR) reactions. The revealing of this information can suggest actions on the surface structure that would enhance its catalytic features. This is an important issue in the technologies where HER/HOR plays an essential role: the proton exchange membrane electrolyzers and the fuel cells [5,6], and the nano-structured surface electrodes [7,8]. To access the component peaks of the CVs and extract these details, the deconvolution of their cathodic and the anodic branches using an asymmetric double sigmoid (ADSig) function was tested on model platinum-black electrodes. The function is adapted to the voltammetric application and is used with a general program for nonlinear fitting [9]. It includes five adjustable mathematical and electrochemical parameters that enable a quantitative approach to the peak separation on the whole CV signal. The ADSigCV function and its use are discussed in Appendix A and Appendix B. The first attempt to separate the peaks in the H region of Pt-black electrodes was made on the anodic branch of CV with a geometrical model (“a simple triangle approximation”) [10,11]. Using a mathematic model and the digital processing of the experimental CV data improved the procedure further [12]. However, separating the peaks from the voltammograms or the polarograms [13,14] remains laborious, implying a time-consuming activity. This makes it challenging to implement as a routine procedure in voltammetric applications. The nonlinear curve fitting has proved to be a way to overcome these hindrances in the case of electro-analysis [15] and the Pt electrodes [16-18]. The procedure compares the experimental voltammetric current, Ie(x), with the calculated current, Ic=∑yi(x; pi), expressed as the sum of the peak functions, yi(x; pi), containing a set of pi parameters; x is the electrode potential. The peak functions are modeled by adjusting the pi-values to generate the curve that best fits the CV data set. Appropriate software automatically performs this operation with iterative nonlinear regression [19-21]. The literature provides several empirical peak functions for constructing the best-fitting curves, mainly referring to the bell-shaped (symmetric) signals and only a few to the asymmetric ones [9]. Hence, these functions cannot be used in the H-region of the CVs of the Pt-black electrodes where the component peaks exhibit asymmetrical shapes. Moreover, the mathematical expressions of these peak functions are cumbersome, and the adjustable parameters are the geometrical characteristics of the peaks [21] that can hardly be correlated with the physical features of the electrode reaction or predicted in advance.
Experimental
Complete CVs were recorded at three different values of the minimum scanned potential, around the equilibrium potential, Emin = -0.027 V, -0.017V, and +0.005 V, and the maximum value, Emax = 1.51 V at a scan rate of 10 mV s-1. The CVs always started from the resting potential of the Pt-black electrodes, running in the cathodic direction, then reversing the scanning at Emin, and finally halting in the cathodic region at 0.5 V after the completion of the anodic cycle. The CVs were twice recorded for each value of Emin. The measurements were carried out in a solution of 1M HClO4 (Merck analytical grade purity) at 298K in a three-electrodes cell. The working electrode was a Pt disk of 1.5 cm in diameter attached to a Pt wire embedded in a thin silicon coating; the exposed geometrical surface area was 3.6 cm2. The Pt-black was galvanostatically deposited in a 2% H2PtCl6 (Sigma-Aldrich) solution at 600 mA for 60 s and stabilized by five CV cycles at 20 mV s-1. Before deposition, the Pt disk was abraded with fine Al2O3 powder and cleaned in an ultrasonic bath with laboratory-grade water II (Sigma-Aldrich). The counter electrode was a Pt wire, and the reference electrode was a hydrogen electrode (RHE) placed in a separate tube within the cell, with the Luggin capillary top near the surface of the working electrode. A homemade galvanostat-potentiostat, compliant with the standard requirements for small-scale electrochemical equipment, was used: voltage range ±10V, current range ±1A, sampling interval 10-2 s [22].
RESULTS AND DISCUSSION
HER/HOR Voltammograms
The hydrogen region of the voltammograms of the Pt-black electrodes below 0.5 V corresponds to the hydrogen evolution reaction (HER, the negative branch) and the hydrogen oxidation reaction (HOR, the positive branch). These segments of the CVs are shown in Figure 1: curve I (Emin= -0.027V), curve II (Emin= -0.017V), and curve III (Emin= +0.005V). The cathodic branches of the voltammograms practically overlap and exhibit two discharging peaks at 0.3V (c1) and 0.1 V (c2).These correspond to strongly and weakly adsorbed H [2]. The anodic branches of the voltammograms, curve I and II, exhibit three H-ionization peaks: a small peak well below 0.1V (a3), a well-defined peak at 0.15 V (a2), and a poorly resolved peak at 0.34 V (a1). The relative positions of the peaks on curve III are like those on curves I and II but shifted on the potential axis by about 30 mV towards the positive values. The peaks a2 and a1 are attributed to the ionization of the weakly H*w - and strongly H*s -adsorbed hydrogen [9,10], while the peak a3 is still unidentified. The total surface area TSA calculated with the anodic charge Qva was TSA = 586±5 cm2 (0.21 mC =1cm2 [23]).
The Deconvolution of HER/HOR Voltammograms
The fine structure of CVs displayed in Figure 2A was revealed by deconvolution of the experimental data set with the Fityk peak fitting software [9] and the ADSigCV function, Eq. (1A), Appendix A. The function processes five adjustable parameters to get the curve that best fits the raw data and is appropriate for multiple current peak data with asymmetric shapes [13]. The operation details are given in Appendix B.
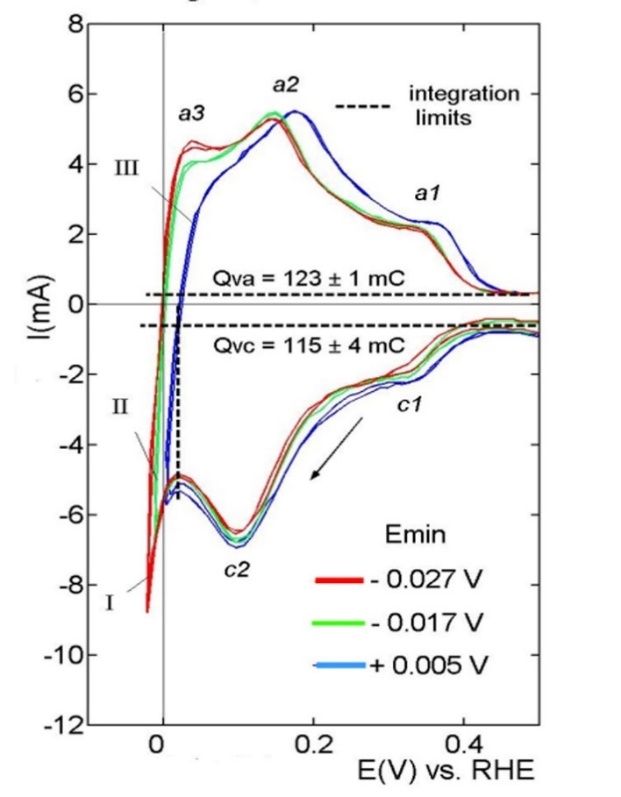
Figure 1: The H-region of CVs recorded by different values of the minimum scanning potential, Emin. Qva and Qvc are the average charge values for the anodic and cathodic curves.
HER
The best fitting curves to the CVs of the hydrogen region are shown in Figure 2A for the three voltammograms (Ic: Emin = -0.027 V; IIc: Emin = -0.017 V and IIIc: Emin = +0.005 V). The symbols (-o-) are the experimental data, the black lines are the best-fitting of Eq.1A (Appendix A) to the data, and the curves c1, c2, and c3 are the components of the best-fitting curves.-The fine structure of the cathodic branches is practically identical for all three cases and consists of two closed curves, c1, and c2, with the average peak potential Ec1(av) = (0.300 ± 0.003) V and Ec2(av) = (0.097 ± 0.002) V, and the open curve c3.
The HER starts by simultaneously discharging the H+ - ions at the strong adsorption sites (curve c1) and the weak adsorption sites (curve c2), but they develop differently. The discharging at the strong adsorption sites terminates at the reversible hydrogen potential, and the current decays towards zero value, curves c1, Figure 2A. Consequently, the HER stops at the strong adsorption sites but continues at the weak adsorption sites [24]. Hence, the equivalent surface area, corresponding to the fraction of weak adsorption sites, constitutes the actual electrochemical active surface area (EASA). The remaining equivalent surface area is inactive. Naturally, the EASA value is smaller than the total surface area (TSA) calculated from the charge of the whole voltammetric curve. The open curve c3 corresponds to a new H+- discharging reaction starting at about 0.2V (coverage qw~30% of the weak adsorption sites). Running simultaneously of two H+- ion discharging reactions necessary implies two different types of sites Figure 2B. In this case, the free adsorption sites (Volmer step, c2 -->) and the occupied adsorption sites, on the weakly adsorbed H*w – atoms (Heyrovsky step, c3 -->). Hence, HER occurs by the Volmer–Heyrovsky mechanism with the electron transfer directly to the solvated proton H+(aq), according to the reaction H+(aq) + e-+ Hw* ----> (H2*) --˄-->H2 (gas) [25,26]. The interrupted arrow (--˄-->) suggests that the weakly adsorbed hydrogen is firmly attached to the electrode surface regardless of whether the evolution takes place and can be identified on the anodic branches of HOR by the peaks a3
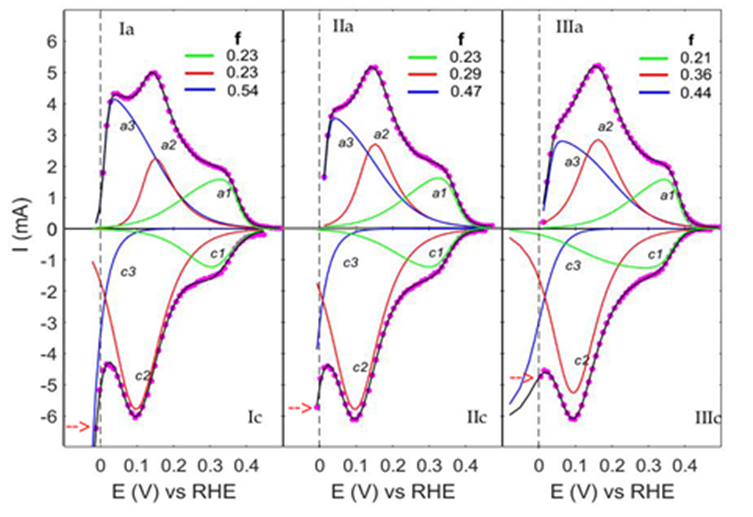
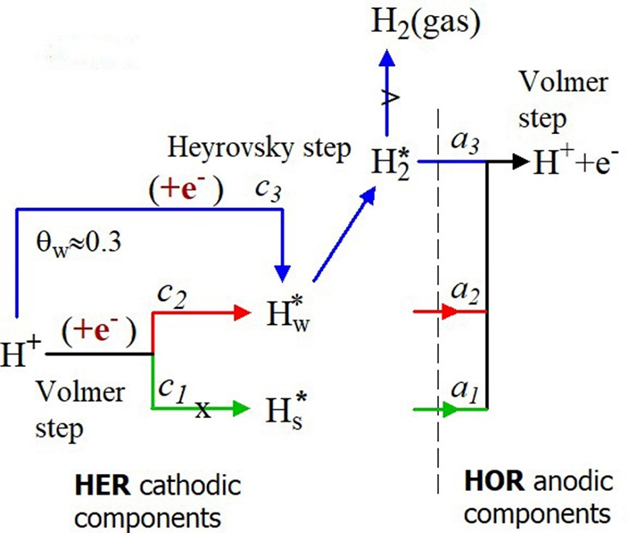
Figure 2: The fine structure of the CVs (A): (--> marks Emin), and the corresponding elementary steps in (B). ai and ci are the anodic and the cathodic components. The dots are the experimental data, the overlapping black lines are the best-fitting curves, and f is the coverage fraction of components in the anodic branch. Hs* is the strongly-, Hw* is the weakly-adsorbed species, and H2* represents the weakly-adsorbed molecules.
HOR
The best fitting to the HOR data is shown in Figure 2A (Ia, Emin=-0.027V; IIa, Emin=-0,017V and IIIa, Emin=+0.005V) for the three voltammograms. The dots are the experimental data, and the overlapping black lines are the best-fitting curves of Eq.(1A), Appendix. A. The components of the best-fitting curves are a3, a2, and a1.
T The fine structure of the anodic branches exhibits three skewed peaks with the average peak potential values Ēa3 = (0.048 ± 0.013) V, Ēa2 = (0.155 ± 0.007) V, and Ēa1 = (0.332 ± 0.01) V. The voltammetric current arises from overlapping the peaks generated by ionizing the H-atoms (Volmer step), belonging to three adsorption states. The peaks a2 and a1 are ascribed to the weakly and strongly adsorbed hydrogen atoms, and the peak a3 to weakly adsorbed pairs of hydrogen atoms or molecular hydrogen (Figure 2B). The peak a3 corresponds to a bound state on the weak adsorption sites and shares their occupancy with the weakly adsorbed H*w - atoms (peaks a2). This results from the balance of the coverage fraction f shown in Figure 2A (f is the fraction of the total number of adsorption sites covered by every single component of the anodic branch). By decreasing Emin (---> in the figure) towards negative values, moving from IIIa to Ia, the f-values of a3 increase at the expense of a2 from 0.44 to 0.54, but their sum remains constant for all three cases (f-blue+f-red ≈ 0.8). This detail is relevant and shows that the components a3 originated on the electrode surface from the weakly adsorbed H*w in a definite quantitative relationship and not randomly by the fluctuation of H2 concentration in the adjacent solution layer [10].
CONCLUSION
1. ADSigCV-function embedded in a general program for peak fitting enables separation and quantitative analysis of CV component peaks.
2. The structure of the Pt-black catalyst is composed of 80% weak adsorption sites, which are active in the HER, while the remaining are passive. The fraction of weak adsorption sites constitutes the actual electrochemical active surface area (EASA)
3. The Volmer-Heyrovsky mechanism determines the HER dynamic, which starts at positive potential by UP hydrogen deposition.
Acknowledge: Thanks to Prof. Emeritus Rolf Berger for valuable comments related to the manuscript.
Appendix A
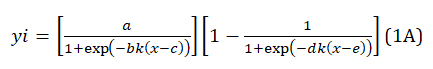
ADSigCV: The peak current function yi is defined by the asymmetric double sigmoid function adapted to the voltammetric applications ADSigCV, eq(1A) [16,17]. This function uses five adjustable parameters (a,b,c,d,e) and is constructed as a product of two sigmoids [27]: the regular(up)-sigmoid, y1, and the inverted(down)-sigmoid, y2, (the enclosed figure)
yi = (a/(1+exp(-bk(x-c))))(1-1/(1+exp(-dk(x-e)))) (1A)
a = the maximum amplitude of the up sigmoid; b, d = the slope of the tangents at the inflection point (electrochemical parameters); k = nF/2.303RT, n = the stochiometric numbers of electrons per adsorption site involved in the electrode reaction); c, e = the abscissa at the inflection point, k = 16.91 V-1 by T = 298K, x = potential (V). The parameters optimization with the Fityk program [9] returns the peak yi displayed on the graph. The peak potential, Ep, and the peak current, Ip, can be estimated directly on this, while the peak charge, Qp, can be calculated by numerical integration of the peak (Appendix B).
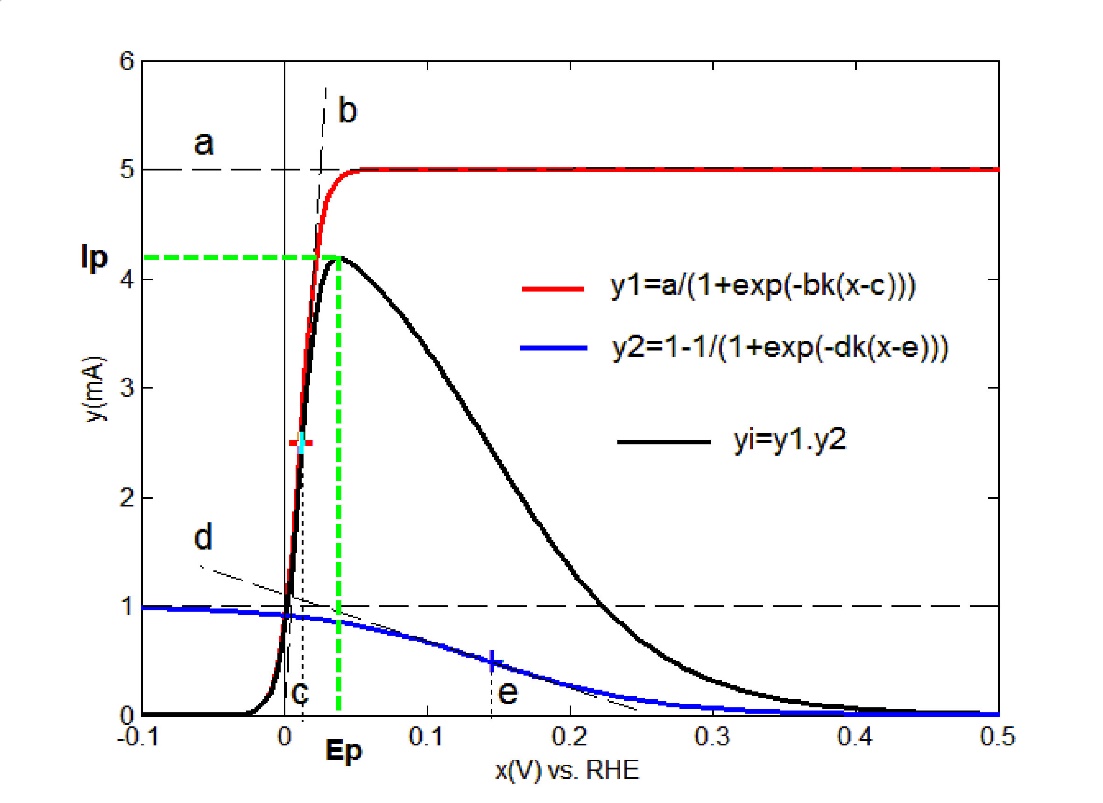
OBS: The calculated peak yi corresponds to the peak a3 displayed in figure 2, Ia.
The peak functions used in the fitting programs are empirical mathematic formulas [18] that formally describe the bell-shaped curves but have no connection with the physical model envisaged in the study. Additionally, the features of the separated peaks sensibly depend on the type of mathematical formula, which makes the quantitative analysis of the deconvoluted peaks irrelevant. The ADSigCV function can be considered a generalized algebraic expression of the physical model calculated on the electrochemical kinetics principles [12]. The scientific form of Eq.(1A) is
. 
and becomes eq.(2A) when using three adjustable parameters, namely d=b and e=c:
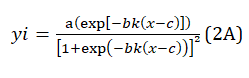
Eq. (2A) has an identical structure to the physical model function calculated in [12], which ensures the reliability of the quantitative analysis of the deconvolution data.
Appendix B
ACTION (How to build the operation program)
1). Download Fityk-1.3.1-setup.exe from the web (free) and install it
2). Add User-Definition Function (UDF): Session(tb)/New Script/Blank Fityk Script. Copy and paste in the unnamed window the sequence (for T=298K): define ADSigCV(a=height, b, c=center, d, e=center) = (a/(1+exp(-b*16.91*(x-c))))*(1-1/(1+exp(-d*16.91*(x-e))))
3). Save as(#b): ADSigCV.fit
FITTING PROTOCOL *) (How to use the operation program)
1). Functions(tb)/Function Type/ADSigCV (on the bottom of the list)
2). Load the file with the data points set: Data(tb)/Quick Load File/name.txt
3). Visual baseline correction (if applicable): Baseline Mode(#b), mark the level of the capacity charging current, Strip background(#b)
4). Initial guess (mouse pointer): mark (approximately) the position of every peak on the data point curve ---> Add-Peak Mode(#b)/Initial value: b=1, OK; d=1, OK.
5). Unlock parameters b and d: functions(sb)/Name: 1,2,3 --->Star fitting(#b)
6). Repeat fitting with shape constraint on the long side of each peak: functions(sb)/Name_1: d=1, freeze; Name_2: d=1, freeze; Name_3: b=1, freeze. Start fitting(#b).
7). Session(tb)/Save session/name.fit
CALCULATION OF PEAK CHARGE FOR THE ANODIC BRANCH
1).Data(tb)/Export Points/Step 1: Select columns: x, y, all component functions, OK/save/name.dat 2). Data(tb)Load File/name.dat; Select columns: x=1; y=2-6 /Open in the new slot (for each value of y)/Close 3).Choose: Data(sb)/No. (2-6), Data(tb)/Transformation/Integrate (for each item successively); Data(tb)/Table: choose the constant initial yi and final yf values, calculate the charge Q=(yf - yi)100 mC
OBS: (tb)=toolbar; (sb)=sidebar; (#b)=symbol button.
Valid with positive values of the dependent variable. The data of the cathodic branch, Ic<zero, must be adapted for processing, Ic*(-1).
REFERENCES
- Breiter MW. (1964). Isotherms for hydrogen adsorption on platinum electrodes in sulfuric acid solution. J Electroanal Chem. 8:449-453.
- Armand D, Clavilier J. (1987). Quantitative analysis of the distribution of the hydrogen adsorption states at platinum surfaces. Part I. Application to Pt(100) in sulphuric acid medium. J Electroanal Chem. 225:205-214.
- Armand D, Clavilier J. (1987). Quantitative analysis of the distribution of the hydrogen adsorption states at platinum surfaces. Part II. Application to Pt(110), stepped and poly-oriented platinum surfaces in sulphuric acid medium. J Electroanal. Chem. 233:251-265.
- Solla-Gullon J, Rodriguez P, Herrero E, Aldaz A, Feliu JM. (2008). Surface .characterization of platinum electrodes. Phys Chem Chem Phys. 10:1359–1373.
- Ursua A, Gandia LM, Sanchis P. (2012). Hydrogen Production from Water Electrolysis: Current Status and Future Trends. Proceeding of the IEEE. 100:410-426.
- Génevé T, Turpin C, Régnier J, Rallières O, Verdu O, Rakotondrainibe A, et al. (2017). Voltammetric methods for hydrogen crossover diagnosis in a PEMFC stack. Fuel Cell. 17:210-216.
- Daubinger P, Kieninger J, Unmussig T, Urban GA. (2014). Electrochemical characteristics of nanostructured platinum electrodes – a cyclic voltammetric study. Phys Chem Chem Phys. 16:8392-8399.
- Diaz-Morales O, Hersbach TJP, Badan C, Garcia AC, Koper M. (2018). Hydrogen adsorption on nano-structured platinum electrodes. Faraday Discuss. 210:301-315.
- Wojdur M. (2010). Fityk: a general-purpose peak fitting program. J Appl Cryst. 43:1126-1128.
- Franklin TC, Naito M, Itoh T, McClelland DH. (1970). The relationship between the amount of adsorbed hydrogen and the potential of the hydrogen electrode. J Electroanal Chem. 27:303-313.
- Kinoshita K, Lundquist J, Stonehart P. (1973). Hydrogen adsorption on high area . platinum crystallites. J Catalysis. 31:325-334.
- Rakotondrainibe A, Beden B, Lamy C. (1994). Investigation of the early stages of Hads and OHads adsorption on rhodium in alkaline medium. Part I: Approaches from graphical treatments of cyclic voltammograms based on a langmuirian isotherm. J Electroanal Chem. 379:455-465.
- Ivanka P. (1994). Deconvolution of non-resolved voltammetric signals, Anal Chim Acta. 285:95-102.
- Huang W, Henderson TLE, Bond AM, Oldham KB. (1995). Curve fitting to resolve overlapping voltammetric peaks: model and examples. Anal Chim Acta. 304:1-15.
- Dimitrov JD. (2004). Compact program resolves overlapping voltammetric peaks, Anal Bioanal Chem. 379:312-317.
- Bucur RV. (2014). Structure of the voltammograms of the platinum-black electrodes: Derivative voltammetry and data fitting analysis. Electrochim Acta. 129:76-84.
- Bucur RV. (2014). Corrigendum to “Structure of the voltammograms of the platinum black electrodes: Derivative voltammetry and data fitting analysis. Electrochim Acta. 129:76-84.
- McCrum IT, Janik MJ. (2017). Deconvoluting cyclic voltammograms to accurately calculate Pt electrochemically active surface area. J Phys Chem. C 121:6237-6245.
- Motulsky HJ, Ransnas LA. (1987). Fitting curves to data using nonlinear regression; a practical and nonmathematical review. FASEBJ. 1:365-374.
- Jakubowska M. (2011). Signal Processing in Electrochemistry. Electroanalysis. 23: 553-572.
- Romanenko SV, Stromberg AG. Pushkareva TN. (2006). Modeling of analytical peaks: Peaks properties and basic peak functions. Anal Chim Acta. 580:99–106.
- Irving P, Cecil R, Yates MZ. (2021). MYSTAT: A compact potentiostat-galvanostat for general electrochemistry measurements. HardwareX. 9:e00163.
- Trasatti S, Petrii OA. (1991). Real surface area measurements in electrochemistry. Pure Appl Chem. 63(5):711-734.
- Conway BE, Tilak BV. (2002). Interfacial processes involving electrocatalytic evolution and oxidation of H2 and the role of chemisorbed H. Electrochim Acta. 47:3571-3594.
- Kurapati N, Buoro RM, Amemiya S. (2020). Perspective-Beyond the Century-Long Paradigm of Hydrogen Electrochemistry through the Laviron-Amatore Paradox. J Electrochem Soc. 167:146514.
- Jespe LH, Ley MB, Lee YS, Cho YW, Dornheim M, Jensen JO, et al. (9) (2014). Boron-nitrogen based hydrides and reactive composites for hydrogen storage. Materials Today. 17:129-135.
- Lipovetsky S. (2010). Double logistic curve in regression modeling. J App Statistics. 37:1785-1793.